Company News
BEST Cement: Benchmarking and Energy Savings Tool for the Cement Industry
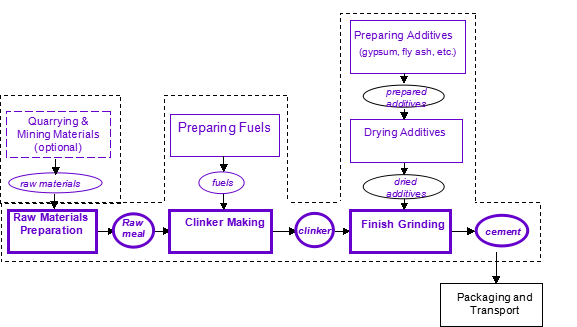
The Benchmarking and Energy Savings Tool (BEST) Cement is a process-based tool based on commercially available efficiency technologies used anywhere in the world applicable to the cement industry. This version has been designed for use in China. No actual cement facility with every single efficiency measure included in the benchmark will likely exist; however, the benchmark sets a reasonable standard by which to compare for plants striving to be the best. The energy consumption of the benchmark facility differs due to differences in processing at a given cement facility. The tool accounts for most of these variables and allows the user to adapt the model to operational variables specific for his/her cement facility. Figure 1 shows the boundaries included in a plant modeled by BEST Cement.

Figure 1: Boundary conditions for BEST Cement
In order to model the benchmark, i.e., the most energy efficient cement facility, so that it represents a facility similar to the user’s cement facility, the user is first required to input production variables in the input sheet (see Section 6 for more information on how to input variables). These variables allow the tool to estimate a benchmark facility that is similar to the user’s cement plant, giving a better picture of the potential for that particular facility, rather than benchmarking against a generic one.
The input variables required include the following:
.the amount of raw materials used in tonnes per year (limestone, gypsum, clay minerals, iron ore, blast furnace slag, fly ash, slag from other industries, natural pozzolans, limestone powder (used post-clinker stage), municipal wastes and others); the amount of raw materials that are preblended (prehomogenized and proportioned) and crushed (in tonnes per year);
· the amount of additives that are dried and ground (in tonnes per year);
· the production of clinker (in tonnes per year) from each kiln by kiln type;
· the amount of raw materials, coal and clinker that is ground by mill type (in tonnes per year);
· the amount of production of cement by type and grade (in tonnes per year);
· the electricity generated onsite; and,
· the energy used by fuel type; and, the amount (in RMB per year) spent on energy.
The tool offers the user the opportunity to do a quick assessment or a more detailed assessment – this choice will determine the level of detail of the energy input. The detailed assessment will require energy data for each stage of production while the quick assessment will require only total energy used at the entire facility (see Section 6 for more details on quick versus detailed assessments).
The benchmarking tool provides two benchmarks – one for Chinese best practices and one for international best practices. Section 2 describes the differences between these two and how each benchmark was calculated. The tool also asks for a target input by the user for the user to set goals for the facility.
2:Energy Modeling
a. Process based modeling
Energy use at a cement facility is modeled based on the following main process steps:
1. Raw material conveying and quarrying (if applicable)
2. Raw material preparation:
a. pre-blending (prehomogenization and proportioning)
b. crushing
c. grinding
3. Additive preparation
4. Additive drying
5. Fuel preparation
6. Homogenization
7. Kiln systems
a. preheater (if applicable)
b. precalciners (if applicable)
c. kiln
d. clinker cooler
8. Final grinding
All energy used for each process step, including motors, fans, pumps and other equipment should be included in the energy use entered for each step (see below for what energy is included in these steps).
In addition, the model separately calculates energy requirements for other conveying and auxiliaries and for additional non-production uses, such as lighting, office equipment and other miscellaneous electricity uses. Any energy not accounted for elsewhere but included in the boundary in Figure 1 should be included here in this input variable.
Because clinker making accounts for about 90% of the energy consumed in the cement making process, reducing the ratio of clinker to final cement by mixing clinker with additives can greatly reduce the energy used for manufacture of cement. Best practice values for additive use are based on the following European ENV 197-2 standards: for composite Portland cements (CEM II), up to 35% can be fly ash and 65% clinker; for blast furnace slag cements (CEM III/A), up to 65% can be blast furnace slag and 35% clinker.
b. Chinese best practice values
To determine Chinese (domestic) best practice values, four modern Chinese cement plants were audited and best practices determined at each plant by the Energy Research Institute (ERI) and the China Cement Association. Two of these plants were 2000 tonnes per day (tpd) and two were 4000 tpd.
Chinese best practices for each stage of production were determined from these plants. Where no data was available (for example, non-production energy use), international best practices were used.
c. International best practice values
For the international best practices at each stage of production, data were gathered from public literature sources, plants, and vendors of equipment. These data and calculations are described below.
Great Wall Machinery Co.,Ltd is the First-class flour equipment suppliers in china .we can supplier : turnkey cement plant, cement equipment, rotary kiln,vertical roller mill, ball mill ..etc.


